What is LiDAR?
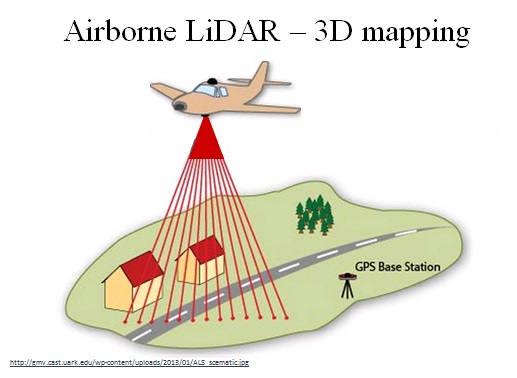
Airborne light detection and ranging technology (LiDAR) uses a laser scanner, along with a global positioning system (GPS), to provide extremely accurate 3D measurements of the landscape, such as tree heights and stand density. The laser scanner measures the locations of features on the earth’s surface relative to the aircraft while, at the same time, the GPS determines the location of the aircraft (Figure 1).
Modern laser scanners can emit more than a 100,000 laser pulses per second and thus quickly generate large amounts of point measurements with elevation and location information. The closer the points are together, the smaller the features that can be consistently identified with the data.
LiDAR coverage of Connecticut has increased rapidly in recent years with data having been acquired for nearly 75% of the state since 2010. These data were intended to model terrain so they were collected in the late fall when the leaves were off of the deciduous forest canopy trees. The lack of leaves allows laser pulses to penetrate the canopy more easily and reach the ground, which is ideal for terrain models. However, data collected during leaf-off conditions may be less ideal for measuring forest canopy height and density. LiDAR did underestimate the canopy height by only about 1.5 meters on average when the data was collected during leaf-off conditions.
Locating problem trees closest to the power lines
![]()
Mapping and measuring heights for individual trees with LiDAR is an ongoing challenge. Nonetheless, we can make a good assessment of power line tree concerns by simply creating a grid that reflects the height of the forest canopy at any given location. The heights of the grid’s cells and their distance from the power lines can then be used to determine whether the forest canopy at that location is tall enough and close enough to strike the power line. We refer to the grid cells in which the forest canopy can pose a risk to the power lines as tree proximity cells (figure 2). To date, we have mapped out the tree proximity cells throughout eastern Connecticut and, over the next several months, we will map them out for the nearly 75% of the state where LiDAR data are available.
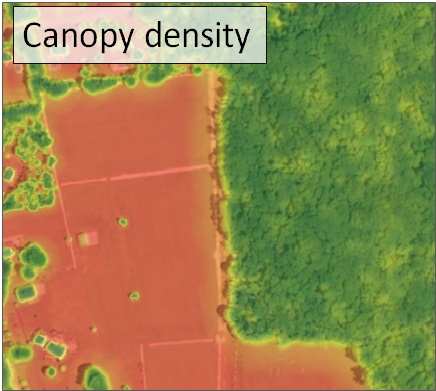
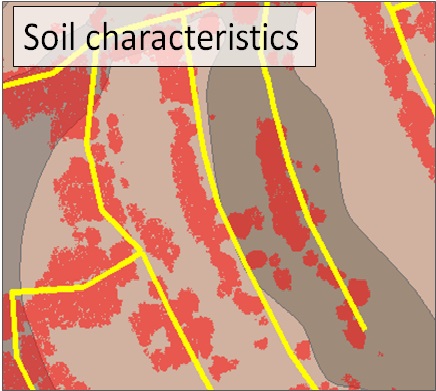
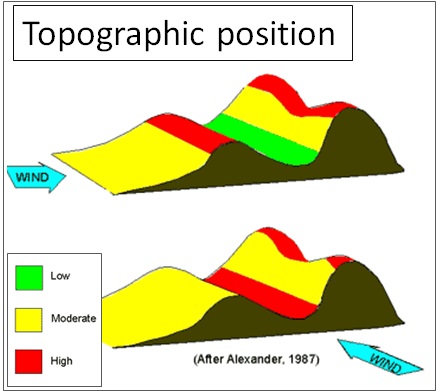
Which characteristics of the forest help predict tree failure?
Mapping the tree proximity cells is only a first step in assessing the risk that roadside forests pose to utility infrastructure. A tree located near a power line doesn’t necessarily have a high potential for failure. Based on biomechanics research, Stormwise’s investigators suspect that certain characteristics of a forest stand can help predict the likeliness of tree failure during a storm. Stand density is one important factor that may help predict tree failure and fortunately, this is another characteristic that we can estimate with LiDAR. We can also measure attributes like the slope and orientation of the ground and the roughness of the canopy which can affect the exposure of trees to the wind.